After comparing African countries’ GDP per capita in the last entry , we wondered how to visualize standards of living using multiple dimensions rather than just GDP per capita. A straightforward solution is to simply make one graph for each of the dimension. However, this will quickly gets out of hand as the number of dimensions grows large.
A better solution is to use Gower distance coefficient, which measures how different two things are based on multiple criteria. Gower distance ranges from 0 (i.e. these two are identical) to 1 (i.e. these two have the farthest distance in the population).1
In this graph, I calculate the Gower distance for all African and Latin American countries and plot it on a heat map. The darker a cell, the higher the distance between the two corresponding countries in the x- and y-axis.
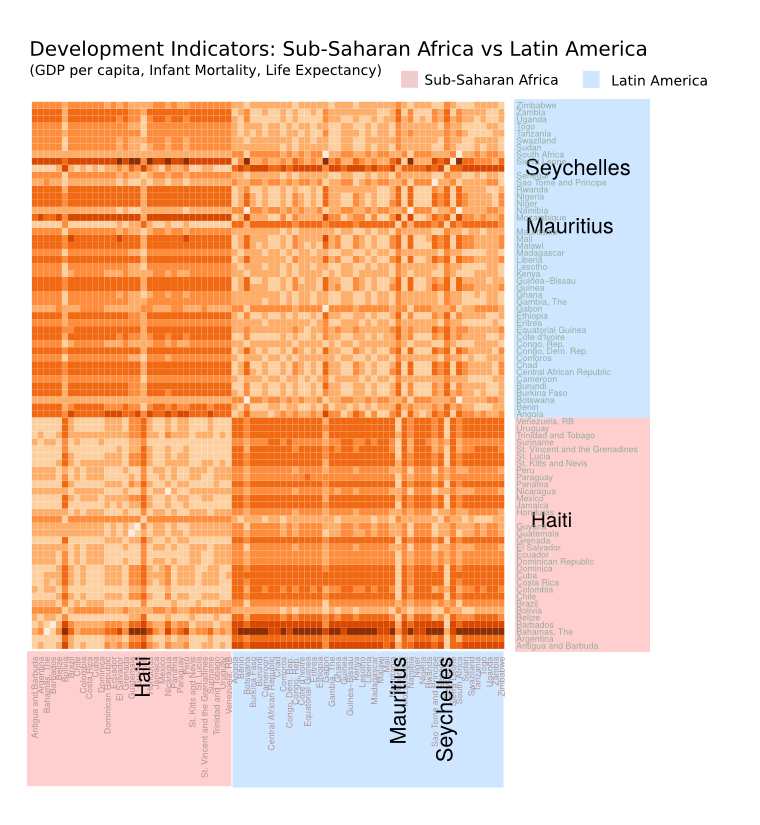
In the top-right quadrant, Sub-Saharan countries are compared with themselves. In the bottom-left quadrant, Latin American countries are compared with themselves. Since countries in the same region are similar to one another, these two quadrants have light colors. On the other hand, the top-left and the bottom-right quadrants are where Sub-Saharan Africa and Latin America are compared against one another, so the colors are darker. The graph shows that variation across region is larger than variation within region.
That’s an intuitive finding. What’s more interesting to see is:
- There is slightly more variation (i.e. more red) within Sub-Saharan Africa (top-right) than within Latin America (bottom-left).
- Within each region, there are a few outliers, whose name are in large fonts. Seychelles and Mauritus have dark cells in top-right and light cells in top-left, meaning that they are on Latin America’s level of development instead of Sub-Saharan Africa’s. In contrast, Haiti is exceptionally poor compared to the rest of Latin America.
How we plot the graphs:
-
Gower distance coefficient is particularly popular since
- It works with missing data
- It works with regardless of the data type of the dimensions (either binary, categorical, or continuous)
- The distance matrix it creates is easily interpretable on the Euclidean space
You can read about the Gower coefficient’s mathematical construct and its implementation in R. ↩